A recent report from the American Council of Education, Tools in a Toolbox: Leading Change in Community Colleges, notes that “data provide an entry point, even an excuse, to bring individuals together to cognitively engage in a learning process to identify new institutional practices for improvement” (Lester, 2020 p. iii)[1] Of course, this is easier said than done. Each step in the process of transforming data into meaningful, actionable information has potential roadblocks. For example, campus administrators may question the validity of the data, or the way data are analyzed. Faculty may have additional concerns that the data are being used for critical evaluations of their teaching methods and abilities. For transformative data use to be successful, college staff must believe that leadership values the data, understand and accept the validity of the data, and be able to and want to act on the data.
The Postsecondary Data Partnership[2] (PDP) is a response to a call to action for the higher education community to improve the use of data to increase student success and helps address many of the concerns listed above that hinder data use on college campuses. The PDP, managed by the National Student Clearinghouse (Clearinghouse), is a nationwide effort to help individual institutions and state systems gain a fuller picture of student progress and outcomes, meet various reporting requirements, and identify where to focus their resources. The partnership is dedicated to the idea that easier access to better data helps higher education professionals develop actionable insights and make informed decisions to support student success. The PDP helps institutions and states be transformative in their data use in four key areas: (1) It empowers the use of data at the campus and state-level; (2) It helps create a uniform language and understanding of higher education data; (3) It includes data on all students; and (4) It gives senior leaders the information needed to more accurately tackle significant state-level issues, such as educational attainment and equity gaps. These four areas are explained in more detailed below.
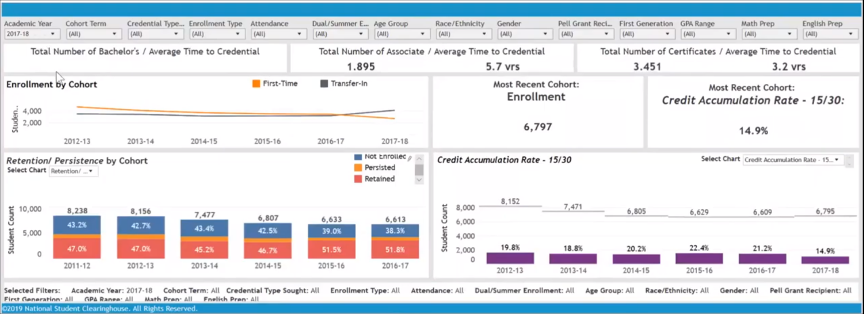
First,
the PDP empowers institutions with better data and access to analytics through
online Tableau dashboards[3] (see
Figure 1) and an easy-to-access downloadable analysis file. The Clearinghouse
currently has nearly a dozen Key Performance Indicator dashboards that include
visualizations for enrollment, gateway course completion, credit accumulation
rate, outcomes, retention/persistence, transfer, and time to credential data.
These dashboards can be easily filtered by metrics such as enrollment
intensity, academic preparedness, race/ethnicity, gender, first-generation
status, Pell grant status, and other important variables. A Tableau
administrator for each institution has the ability to add dashboard users so
that this important data can be shared across the entire campus and different
functional offices. These dashboards are available online and do not require an
institution to purchase Tableau software. The Clearinghouse is also developing
the ability to benchmark within the dashboards. In addition to the dashboards,
institutions also receive data through an Analysis-Ready File, an excel file
report where each student’s data are included on a single row, allowing users
to create descriptive statistics, pivot tables easily, or utilize the data for
more extensive analysis. For example, institutions can use PDP data for
predictive analytics or create their own cohorts for tracking students based on
local institutional initiatives.
Figure 1: Example Executive Summary PDP Tableau Dashboard
Second, PDP data definitions are based on the Institute for Higher Education Policy’s (IHEP) Postsecondary Metrics Framework[4]. IHEP staff reviewed a decade’s worth of data elements and their definitions collected by national, state, and voluntary data collections in an attempt to bring consensus to the field regarding common data elements. The Postsecondary Metrics Framework is part of a larger effort for a more inclusive national data infrastructure that enables researchers and policymakers to understand equity and student success better. This work also helps support the validity of data elements and their importance in helping to understand barriers and improve student success.
Third, the PDP includes data on all students at your institution. Unlike other data collections that only include first-time, full-time students or students entering in the fall, the PDP collects information on every student at your institution, regardless of when they started in the year, their enrollment intensity (full or part-time), or if they are a first-time student in higher education or a transfer. This allows institutions to get a full picture of student progress and success, rather than only a partial view.
Finally, like many institution-wide initiatives, it takes senior leadership advocating for the project to be successful. With early-momentum metrics measuring first-year progression through gateway course completion and credit accumulation, the PDP allows senior executives to more accurately understand the impact of the first year of college and is invaluable to both institutions and state systems as they look to increase educational rates and close equity gaps. State leaders should find this information incredibly useful as they seek to better understand and find ways to improve the success of their students.
Tools in a Toolbox: Leading Change in Community Colleges provides four key takeaways for leading change at community colleges that is also applicable to four-year institutions and other higher education sectors. First, leaders should have an explicit change theory and plan that is clear and provides goals. Implementing the PDP to support data-informed decision making can be one aspect of this plan. Second, leadership should be developed to assist in engaging the entire community. This leadership team can also serve as advocates to the PDP work, promoting its use around campus. Third, data and information should be communicated with the community, an aspect where the PDP excels because it allows anyone (with access) to view data. Finally, the vision for change should be communicated in everyday decisions. The PDP can be this vehicle for data-informed decision making that impacts all areas of campus culture and student support.
To learn more about the PDP, you can contact the Clearinghouse via email at PDPService@studentclearinghouse.org, or reach out to Eric Godin at SHEEO.
[1] Lester, Jaime. (2020). Tools in a toolbox: Leading change in community colleges. American Council on Education.
[2] Postsecondary Data Partnership webpage, National Student Clearinghouse. Available at https://www.studentclearinghouse.org/colleges/pdp/
[3] Video tutorials for the PDP Tableau dashboard’s are available at https://www.studentclearinghouse.org/colleges/pdp/video-tours/
[4] Postsecondary Metrics Framework. Institute for Higher Education Policy. Available at http://www.ihep.org/postsecdata/resources-reports/metrics-framework-technical-guide