The State Higher Education Executive Officers Association
(SHEEO) welcomes Dr. Tom Harnisch as our new vice president for government
relations.
As vice president for government relations, Dr. Harnisch
will be located in Washington, D.C., and his primary leadership responsibility will
be for planning, implementing, and coordinating SHEEO’s portfolio of federal
relations, policy, communication, and advocacy work. This position will monitor
new and potential federal action (legislation, rules, and other policies and
actions) that have relevance to our membership. The vice president for
government relations will also be responsible for bringing these issues to the
attention of SHEEO staff and SHEEO’s membership and for articulating their
potential impact on our members and the institutions and students they serve.
Tom Harnisch
From 2007 to 2019, Dr. Harnisch worked in a series of roles
at the American Association of State Colleges and Universities (AASCU),
including as director of state relations and policy analysis. In his role at
AASCU, his roles included policy research, analysis, and communication to the
AASCU membership and other external stakeholder groups. He helped craft the
AASCU Public Policy Agenda and planned the Higher Education Government
Relations Conference. His research interests and commentary on higher education
finance, access, affordability, and other topics have been cited in over 200
articles, including in The New York Times, The Washington Post, Time magazine, Politico, Inside
Higher Ed, and The Chronicle of Higher Education. He is also an
adjunct faculty member at Georgetown University and The George Washington
University.
“We are excited to have Tom join us at SHEEO,” said Rob Anderson, SHEEO president. “His vast experience will serve our states by amplifying their voice and ensuring greater coordination between federal and state policies, which will allow us to meet the needs of our students in the most effective manner possible.”
ABOUT THE STATE HIGHER EDUCATION EXECUTIVE OFFICERS
ASSOCIATION
The State Higher Education Executive Officers Association
(SHEEO) is the national association of the chief executives of statewide governing,
policy, and coordinating boards of postsecondary education. Founded in 1954,
SHEEO serves its members as an advocate for state policy leadership, a liaison
between states and the federal government, and a vehicle for learning from and
collaborating with peers. SHEEO also serves as a manager of multistate teams
and as a source of information and analysis on educational and public policy
issues. Together with its members, SHEEO advances public policies and academic
practices that enable Americans to attain education beyond high school and
achieve success in the 21st century economy.
A project of the Center for the Study of Education Policy at Illinois State University and the State Higher Education Executive Officers Association (SHEEO)
Contact: Jim Palmer, Editor, Grapevine Center for the Study of Education Policy, Illinois State University
(309) 438-2041; jcpalmer@ilstu.edu
Data reported by the states in the latest Grapevine survey (Tables 1 and 2, attached) indicate that initially-approved state fiscal support for higher education in fiscal year 2019-2020 (FY20) totaled approximately $96.6 billion, a 5.0% increase nationwide from fiscal year 2018-2019 (FY19). This is the highest annual increase since Fiscal Year 2014-15 (FY15) and continues a trend of annual increases over the past six years (see chart at right).
In contrast to the relatively
high number of states reporting annual reductions in funding from FY15 through
FY18, only three states reported funding declines between FY19 and FY20. Alaska sustained an 11.2% decrease, the
result of a gubernatorial decision to substantially reduce funding to the
University of Alaska system over the next three years. Hawaii and New York reported much smaller
declines of 2.2% and 0.3%, respectively. Each of these states had previously met
or exceeded their pre-recession (FY08) levels of state support.
Of the remaining 47 states, 24 reported increases from FY19 to FY20 ranging from 0.7% (Kentucky and North Carolina) to 4.8% (Georgia and Massachusetts), and 23 reported increases ranging from 5.0% (South Dakota) to 11.4% (Colorado). Increases in five states—California, Texas, Illinois, New Jersey, and Tennessee—accounted for approximately half (49.8%) of the total national increase in state funding for higher education between FY19 and FY20. Funding increases in each of these five states ranged from $189.2 million in Tennessee to $1.06 billion in California. Together, these five states increased funding for their higher education systems by 7.3%, while the remaining 42 states collectively increased funding by 4.4%.
Two-Year and Five-Year Trends
Over the longer term, total FY20 appropriations to higher education nationwide are 9.5% higher than funding made available two years ago in FY18. Sixteen states reported two-year gains of 10% or more, ranging from 10.0% in Kansas to 23.7% in Colorado. In addition, another 32 states registered two-year increases ranging from 2.7% in Vermont to 9.4% in New Mexico. Only two states reported that they were operating with levels of state fiscal support in FY20 that are lower than the fiscal support available two years ago in FY18: Alaska, which reported a 9.1% decline from FY18 to FY20, and Kentucky, which reported a two-year decline of 1.7%. Note that the Grapevine data are not adjusted for inflation.
In terms of five-year trends, state support for higher education increased nationwide by 18.8% from FY15 to FY20. Sixteen states reported five-year increases of 20% or more, ranging from 20.3% in New Jersey to 43.9% in Nevada. Another 29 registered five-year gains ranging from 0.5% in Iowa to 18.6% in Maryland. But five states reported five-year decreases ranging from 1.9% in Kentucky to 21.9% in Alaska.
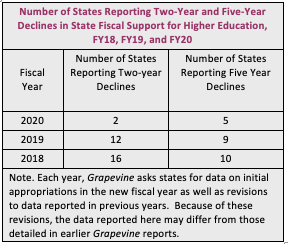
These longer-term trends reflect
a more favorable picture than findings for previous years (see table to the
right). In FY18, higher education
systems in 16 states operated at levels of fiscal support that were below the
levels of support available two years earlier in FY16, and in 10 states, higher
education funding was less than the funding available five years previously in
FY13. In FY19, 12 states operated at levels of state funding that were below the
funding appropriated two years earlier in FY17, and nine states operated at
levels of funding that were below the monies available five years previously in
FY14.
Overall, the results of the FY20 Grapevine survey document continued
increases, albeit at modest levels, in higher education funding across most
states. It is important to note that the Grapevine
data alone do not provide the contextual information needed to compare or rank
states in terms of the fiscal health of their higher education systems. For
example, although Illinois reported a relatively large (9.8%) funding increase between
FY19 and FY20, 66% of that increase represented monies appropriated to strengthen
the state’s badly underfunded college and university pension system and were not
used to fund instruction for students at higher education institutions directly.
Also, the increase reported by Illinois between FY19 and FY20 follows a period
of funding declines in previous years, as evidenced by the relatively low five-year
increase of 4.8% between FY15 and FY20. These are the sorts of nuances that Grapevine data do not capture.
Other Jurisdictions
FY20 marks the fourth year Grapevine has included Washington, D.C.,
in its survey. The data reported by the District of Columbia exclude federal
appropriations and reveal one-year, two-year, and five-year gains in local tax
support of 3.4%, 15.5%, and 22.9%, respectively.
About Grapevine
Grapevine data are collected annually as a joint project of the Center for the Study of Education Policy at Illinois State University and the State Higher Education Executive Officers Association (SHEEO). Tables summarizing the results of the FY20 Grapevine survey—as well as annual Grapevine reports going back to fiscal year 1961—can be found at the Grapevine website: https://education.illinoisstate.edu/grapevine/.
In addition to data on state
fiscal support for higher education by state, Grapevine tables also detail regional variations in state fiscal
support and note trends in state fiscal support per capita and per $1,000 in
personal income.
The FY20 data were collected by Sophia Laderman of SHEEO, employing an instrument that consolidates the Grapevine survey with the annual survey used by SHEEO in its State Higher Education Finance (SHEF) project. Data from the Grapevine component of this consolidated instrument were sent to Illinois State University for analysis.
The Grapevine report intends to provide a first, tentative look at
state higher education funding in the new fiscal year. The FY20 data represent
initial allocations and estimates that are subject to change. SHEEO’s annual
SHEF report focuses on the most recently completed fiscal year and offers a
more complete examination of trends in total state support for higher education,
factoring in enrollment, tuition, and inflation (among other variables). The SHEF
report for FY19 will be released this spring by SHEEO.
Grapevine data include both tax and nontax state support for the
operation of institutions of higher education as well as for other higher
education activities (before the survey for FY10, Grapevine surveys asked for data on state tax appropriations only).
States were asked to provide data for the new fiscal year (2020) as well as
revisions (if necessary) to data on file for previous fiscal years. In addition
to data on funding for four-year colleges and universities, instructions asked
states to include:
sums appropriated for state aid to local public community colleges, for the operation of state-supported community colleges, and for vocational-technical two-year colleges or institutes that are predominantly for high school graduates and adult students;
sums appropriated to statewide coordinating boards or governing boards, either for board expenses or for allocation by the board to other institutions or both;
sums appropriated for state scholarships or other student financial aid;
sums destined for higher education but appropriated to some other state agency (as in the case of funds intended for faculty fringe benefits that are appropriated to the state treasurer and disbursed by that office); and
appropriations directed to private institutions of higher education at all levels.
States were asked to exclude
appropriations for capital outlays and debt service, as well as appropriations
of sums derived from federal sources (except for ARRA monies), student fees, and
auxiliary enterprises.
Different practices among the 50
states make it impossible to eliminate all inconsistencies or to ensure absolute
comparability among states and institutions. In addition, the annual percent
changes recorded for each state do not necessarily reflect the annual percent
changes in funding for individual institutions within states.