The Postsecondary Data Partnership (PDP) is a nationwide effort to help institutions and state systems gain a fuller picture of student progress and outcomes, meet various reporting requirements, and identify where to focus their resources. The partnership is dedicated to the idea that easier access to better data helps higher education professionals develop actionable insights and make informed decisions to support student success. This blog post highlights four specific examples for using PDP data at the state level: state higher education strategic plans and Key Performance Indicators (KPIs), early momentum metrics, educational attainment models, and equity gap analysis.
State Higher Education Strategic Plans and Key Performance Indicators
Data for state higher education strategic plans and KPIs should focus on high-level data elements that include all postsecondary students, are common measures within the field, and can be easily viewed at both the state and institution level. The PDP accomplishes all three of these objectives. First, it collects information on all new incoming students, including first time in college and transfer students, full-time and part-time students, and students beginning in the fall, spring, or summer terms. Second, the PDP is based on the Institute for Higher Education Policy’s (IHEP) Postsecondary Metrics Framework.[1] IHEP staff reviewed a decade’s worth of data elements and their definitions collected by national, state, and voluntary data collections in an attempt to bring consensus to the field regarding common data elements. The Postsecondary Metrics Framework is part of a larger effort for a more inclusive national data infrastructure that enables researchers and policymakers to better understand equity and student success. This work also helps support the validity of data elements and their importance in helping to understand barriers and improve student success. Third, online PDP Tableau dashboards provide state leadership with the ability to look at data at the state level and at individual institutions. Dashboard images can be saved to PowerPoint and Word documents, and aggregate dashboard data can be downloaded for further analysis.
Early Momentum Metrics
Traditionally, higher education has focused on lagging student outcomes, such as graduation rates. However, as we become more data-informed and understand how students move through the education space, it is more important to focus on leading, early, momentum metrics to help with decision-making. Research out of the Community College Research Center (CCRC) at Columbia University Teacher’s College evaluating the impact of credit momentum, gateway course momentum, and persistence momentum indicates that these early momentum metrics are strong predictors of student completion rates.[2] All three of these measures are part of the PDP, and dashboard data can be filtered by multiple dimensions at the same time, such as race/ethnicity, enrollment intensity, and academic preparation, to create targeted subgroups. Further, the PDP also collects early momentum data on developmental education courses and GPA.
State Educational Attainment Models
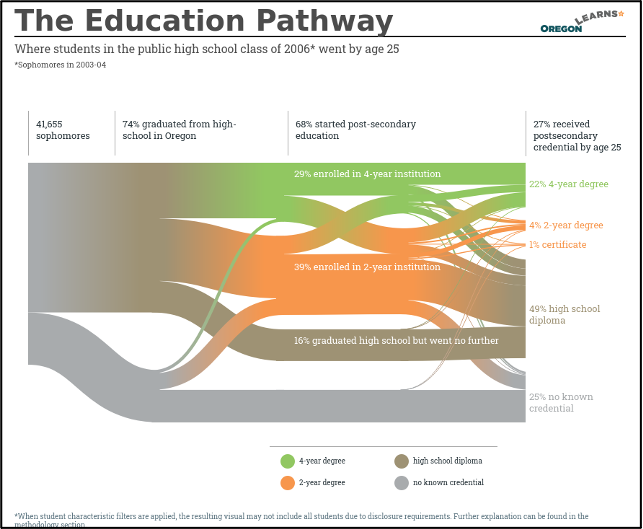
State educational attainment has been a driving force for state policy for over a decade, and reports such as Lumina’s Stronger Nation have helped highlight this work. Through our Communities of Practice project, SHEEO has also helped in this area by bringing together state teams to discuss how to model educational attainment. The state of Oregon has done great work visualizing education pathways from high school through postsecondary education.[3] PDP data on enrollment and early momentum metrics can add great benefit to educational attainment models. As states adjust early momentum metrics, such as gateway completion and retention in attainment models, they can gain a better sense of outcomes and how that impacts your state’s attainment rates.
Equity Gap Analyses
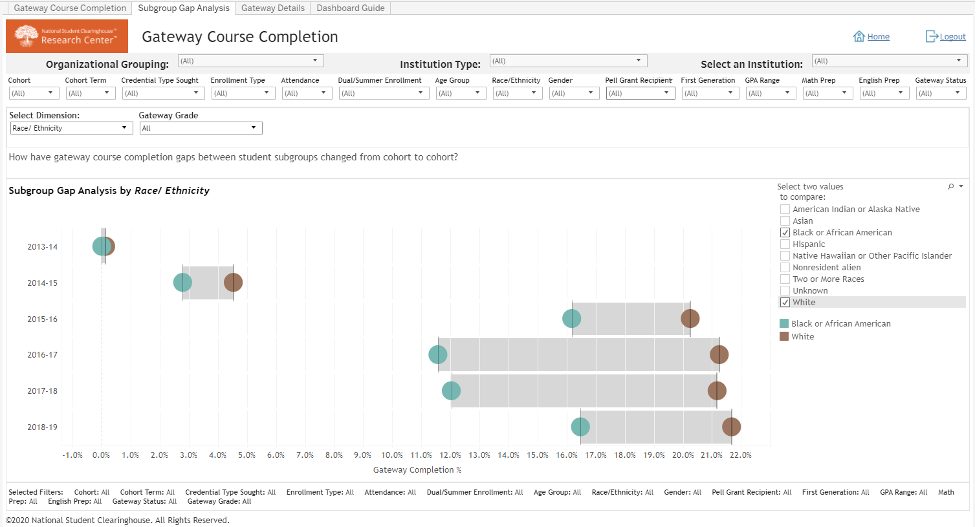
One of the best PDP tools is the subgroup gap analysis within many of the dashboards that let viewers compare two specific groups of students on a specific measure. The subgroup gap analysis is a great way to visualize differences in equity, and the image can be easily downloaded for sharing. The image below shows an example of an equity subgroup analysis comparing gateway course completion for Black or African American students compared to white students. Looking at the data for the most recent three years, we see that the equity gaps decreased, but a larger four-year look does not show a consistent downward trend.
More information on the PDP can be found on the National Student Clearinghouse’s website and SHEEO’s PDP toolkit
[1] Postsecondary Metrics Framework. (2016). Institute for Higher Education Policy. Available at http://www.ihep.org/postsecdata/resources-reports/metrics-framework-technical-guide
[2] Belfield, C. R., Jenkins, D., & Fink, J. (2019). Early momentum metrics: Leading indicators for community college improvement. Columbia University, Teachers College, Community College Research Center. Available at https://ccrc.tc.columbia.edu/publications/early-momentum-metrics-leading-indicators.html