This toolkit serves as a public resource for higher education professionals interested in or already involved in the Postsecondary Data Partnership (PDP). The goal is to support institutions and systems in the adoption of the PDP by providing technical assistance documents that both complement and expand on the information that is already available on the National Student Clearinghouse’s PDP webpage. This site includes technical briefs on specific PDP topics, data use examples for utilizing the PDP Tableau dashboards and Analysis-Ready File, documents from PDP presentations at national conferences, research utilizing the PDP, and a blog which serves to share and communicate PDP information to the higher education community. The toolkit will be updated on a regular basis with new resources.
Postsecondary Data Partnership
The Postsecondary Data Partnership is a nationwide effort to help colleges and universities gain a fuller picture of student progress and outcomes, meet various reporting requirements, and identify where to focus their resources. The partnership is dedicated to the idea that easier access to better data helps you, the higher education professional, develop actionable insights and make informed decisions to support student success. One of the most significant barriers to improved data gathering and utilization by colleges and universities is the cumbersome process of collecting key data and metrics, then reporting them for multiple voluntary and mandatory data collections. The PDP empowers the nation’s colleges and universities with better data and access to analytics to help institutions realize better outcomes.
Upcoming National Student Clearinghouse Presentations
Join us for presentations on how your institution’s participation in the Postsecondary Data Partnership can be used to make transformative data-driven decisions around improving outcomes, increasing student success, and closing equity gaps through the National Student Clearinghouse – Clearinghouse Academy.
SHEEO’s Role
As the national association of the chief executives of statewide governing, policy, and coordinating boards of postsecondary education, SHEEO is well-positioned to collaborate with the National Student Clearinghouse and higher education organizations in the development and dissemination of PDP support resources. A major goal of this webpage is to increase communication among national initiatives utilizing the PDP to develop common support documents and share best practices. SHEEO staff also participate in PDP informational sessions, including webinars, national conferences, and SHEEO-sponsored convenings. This work is funded by the Bill & Melinda Gates Foundation.
Contact
Project Contact: Christina Whitfield, senior vice president and chief of staff.
Why the PDP?
Reduced Reporting Burden
One of the greatest benefits of joining the PDP is reduced reporting burden for institutions and systems that participate in multiple national (and regional) initiatives that require data reporting. For example, Achieving the Dream (ATD), Jobs for the Future (JFF), and Complete College America (CCA) are just a few organizations that are working to support their institutional members in adopting the PDP. When institutions join the PDP, the Clearinghouse will then provide the required data to the appropriate initiative (with institutional approval). Therefore, an institution participating in multiple projects now has only one data submission, rather than multiple submissions in various formats.
Easily Access Tableau Dashboards and Data
Currently, the National Student Clearinghouse provides data back to submitting institutions and systems in two formats. The first, Tableau dashboards are available online and do not require an institution to purchase Tableau software. The dashboards highlight an institution’s data based on the Key Performance Indicators (KPIs) identified by the Clearinghouse (enrollment, credit accumulation, credit completion, gateway/remedial course completion, persistence/retention, outcome completion, credentials conferred, time to credential, and transfer). An Executive Summary dashboard is also available, which pulls together important data from various KPI dashboards. A Tableau administrator for each institution has the ability to add Tableau users, so that these important data can be shared across the entire campus and different functional offices.
The second format institutions receive data in is through the Analysis-Ready File (ARF), an excel file report (wide file format) where each student’s data is included on a single row, allowing users to easily create descriptive statistics, pivot tables, or utilize the data for more extensive analysis. The ARF is a great next step after reviewing your institution’s Tableau dashboards and identifying areas for further analysis. For example, because the ARF includes student identification information, institutions could identify their cohorts based on localized intervention measures and compare those students to other groups based on the PDP KPI metrics.
Benchmarking
The Clearinghouse is also developing the ability to benchmark within the Tableau dashboards, which will be released in Spring 2020. Benchmarking will be available based on sector by state (2-year public, 4-year public/private), Carnegie Classification, Historically Black Colleges and Universities (HBCU), and Hispanic-Serving Institutions (HSI). More information is available on the Clearinghouse website.
Quick Data Turnaround
The Clearinghouse seeks to provide meaningful information back to institutions in a timely manner. This means that institutions will have useable data products (Tableau dashboards and ARF) within a few months of complete data submission. This allows the data to be more actionable, especially for first-year momentum metrics and targeting interventions for students.
Common Data Definitions and Data Language
The PDP data definitions are based on the Institute for Higher Education Policy’s (IHEP) Postsecondary Metrics Framework. IHEP staff reviewed a decade’s worth of data elements and their definitions collected by national, state, and voluntary data collections in an attempt to bring consensus to the field regarding common data elements. The Framework is part of a larger effort for a more inclusive national data infrastructure that enables researchers and policymakers to understand equity and student success better.
Getting Started
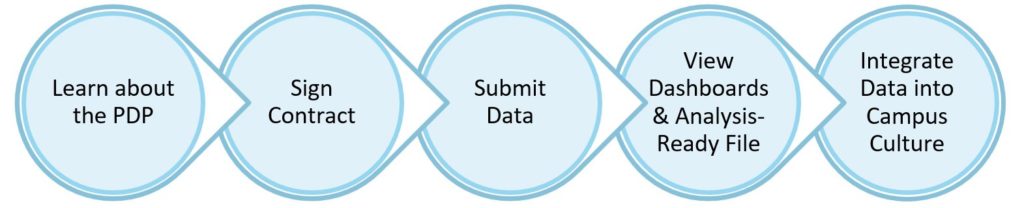
The PDP adoption process can be broken down into five key steps, which are highlighted in Figure 1 below. Although the steps can be thought of in terms of a sequential order, a few steps can be done concurrently to speed up the adoption process. For example, while your institution is reviewing the PDP contract, your institutional research staff can start reviewing the data submission guidelines and formatting the submission files so data upload can be performed as soon as all parties have signed the contract. In addition, senior campus staff can begin reviewing the data available through the Tableau dashboards and analysis-ready-file to determine how they want to utilize these tools and how best to integrate this information into campus conversations and decision-making. The end of this page has documents designed to assist an insitutiton with adopting the PDP.
Figure 1: PDP Adoption Process
Learning About the PDP
There are a number of resources available to learn about the PDP. The best place to start is National Student Clearinghouse’s PDP website. The website contains guides for data submission, templates for the cohort and course files, a data dictionary for the analysis-ready file, a glossary of terms, dashboards, video tours, and more. TheClearinghouse Academy has a PDP course and information on upcoming webinar events. If your institution or system is looking for a more personal introduction to the PDP, webinars can be arranged with staff from the Clearinghouse. If your institution is part of a national initiative (e.g., Achieving the Dream, JFF, Complete College America), staff from that initiative can also be included in the webinar to assist with questions.
Signing PDP Contract
Institutions and systems that are able to identify key stakeholders and “PDP champions” are the most successful in streamlining the contract phase of adopting the PDP. During the contract phase, institutions agree to participate in the PDP and also have the ability to approve the release of their data to higher education initiatives, such as Complete College America and Achieving the Dream. Institutions can allow the release of all their data or specific data elements and this agreement can be modified at any time.
Submitting PDP Data
The Clearinghouse has developed very helpful guides and checklists for data submission. PDP submissions include a cohort file, a course file, and an optional financial aid file. The Clearinghouse Academy’s PDP course and the PDP Data Submission Guide are the best places to begin to understand the technical aspects of PDP data submission. In addition, you can reach out to Clearinghouse staff for support at PDPService@studentclearinghouse.org. SHEEO has also developed a number of technical documents, which can viewed in the Submit Data section of this webpage.
Accessing and Using PDP Data
Currently, the Clearinghouse provides data back to submitting institutions and systems in two formats. The first format is with Tableau dashboards, which are available online and do not require an institution to purchase Tableau software. The dashboards highlight an institution’s data based on Key Performance Indicators (KPIs) identified by the Clearinghouse. An Executive Summary dashboard is also available, which pulls together important data from various KPI dashboards. Tutorials of the Tableau dashboards are available online. A Tableau administrator for each institution has the ability to add Tableau users so that these important data can be shared across the entire campus and different functional offices. The Clearinghouse is also developing the ability to benchmark within the Tableau dashboards.
The second format institutions receive data in is through an analysis-ready file (ARF), an Excel file report (wide file format) where each student’s data is included on a single row, allowing users to easily create descriptive statistics, pivot tables, or utilize the data for more extensive analysis. A data dictionary for the file is available online. The ARF is a great next step after reviewing your institution’s Tableau dashboards and identifying areas for further analysis. For example, because the ARF includes student identification information, institutions could identify their cohorts based on localized intervention measures and compare those students to other groups based on the PDP KPI metrics.
Integrating PDP Into Campus Decision-Making Processes
The final, but most meaningful, step in the PDP adoption process is the integration of PDP data into campus conversations and decision-making. Institutions and systems are most successful when decisions about how data is utilized are driven by a chancellor, president, or other key senior leader. A recent report from the American Council of Education, Tools in a Toolbox: Leading Change in Community Colleges, notes that “data provide an entry point, even an excuse, to bring individuals together to cognitively engage in a learning process to identify new institutional practices for improvement” (Lester, 2020 p. iii).[1] In order for data use to be successful, campus administrators must believe that leadership values the data, understands the data, accepts the validity of the data, and is able to act on the data.
Helpful Resources for Planning Out an Institution's PDP Adoption
Levels of Postsecondary Data Partnership (PDP) Technical AssistanceAs institutions begin the PDP adoption process, it is important to recognize the level of support they might require, because this will impact staff, technology, and financial resources. One way to think about support is to determine how hands-on it will be. For example, this document highlights five levels of PDP support that begin with the most basic (e.g., reading information) and end with the most dynamic and hands-on assistance (e.g., onsite expert support). In addition, different staff may require various levels of support, depending on their involvement with the PDP. As institutions begin the PDP adoption process, think about your campus needs and the resources you will assign to them.
Data Submission
The documents below were developed to assist institutions in submitting data to the PDP.
PDP Guidance for Senior Level Administrators
Defining Gateway Courses for Data SubmissionThis document was developed to assist institutions and state systems in the Postsecondary Data Partnership (PDP) adoption process by providing an overview of how gateway courses are defined by the higher education community. In an attempt to bring consensus, most data definitions for the PDP are based on the Institute for Higher Education Policy’s (IHEP) Postsecondary Metrics Framework . However, the gateway course variable is one of the few defined individually by institutions and systems. Agreement around the definition of gateway courses is an important step in the PDP adoption process and one that may be the most time-consuming task because it can involve convening senior administrators and committees to reach a consensus.
PDP Technical Briefs Highlighting SAS Code for Data Submitters
Using SAS Software to Prepare PDP File UploadsThe objective of this technical brief is to discuss an approach to preparing PDP data collections that consists of formatting both term cohort files and course files using SAS macros. The process used SAS software and macro variables to identify the reporting institution, create additional required identifying fields, and export the files for uploading to the Clearinghouse, using the appropriate file naming conventions. The data preparation approach was employed by a Central Piedmont Community College’s Center for Applied Research (CFAR) analyst during the initial PDP data collection.
Applying Race and Ethnicity Coding to PDP Cohort FilesThe objective of this technical brief is to discuss an approach to prepare PDP data collections that consists of formatting the race and ethnicity fields in the cohort file. The data preparation approach highlighted in this document was employed by a Central Piedmont Community College’s Center for Applied Research (CFAR) analyst during the PDP data collection and yielded successful participation in the PDP. The process utilized SAS software to: (1) Evaluate race and ethnicity fields in the example institution’s student information system, (2) Recode the race and ethnicity fields to meet PDP requirements, and (3) Add the race and ethnicity fields to the PDP cohort files.
Leveraging Cohort and Course Data to Facilitate Developmental Course Completion CodingThe objective of this technical brief is to discuss an approach to preparing developmental course completions data for PDP data submission. The data preparation approach was employed by a Central Piedmont Community College’s Center for Applied Research (CFAR) analyst during the initial PDP data collection. The analyst used the National Student Clearinghouse’s file documentation and sample cohort and course file templates to process files for the cohort and course file extracts.
Using Crosswalks to Facilitate Data Submissions for Gateway Course Requirements and Course Classification of Instructional Program (CIP) CodesThe objective of this technical brief is to explain an approach to prepare PDP data collections that includes the development of term cohort files and course files utilizing crosswalks for 1) gateway course requirements, and 2) course Classification of Instructional Program (CIP) codes. The process was developed by a Central Piedmont Community College’s Center for Applied Research (CFAR) analyst to capture information from four PDP participating institutions in North Carolina. The institutions share a common course library (Combined Course Library) and Colleague student information system through the North Carolina Community College System (NCCCS). Crosswalks were developed to bridge the local information found in the Colleague system to the NCCCS information.
Data Use
The documents below were developed to assist institutions in utilizing PDP data, specifically the Tableau dashboards and the Analysis-Ready File (ARF). The Tableau dashboard quick guides were developed by the American Institutes for Research (AIR).
Dashboard Tool OverviewThis quick guide contains general information on using the PDP Tableau dashboard tool. It begins with the general purpose of the dashboards along with a menu of the available suite of dashboards. Next, it provides definitions for KPIs and other important PDP concepts. It then presents information on the student-level filters and dimensions available to refine and disaggregate the dashboards and introduces subgroup gap analysis. Finally, it highlights important considerations to keep in mind when using the dashboards.
Executive Summary DashboardThis quick guide focuses on the executive summary dashboard, which provides a comprehensive summary of KPI metrics and enrollment data.
Enrollment DashboardThis quick guide focuses on the enrollment dashboard which provides 12-month enrollment counts and key characteristics for students enrolling for the first time at an institution by cohort year.
Dashboard Quick Guides - Early Momentum Metrics
Credit Accumulation Rate DashboardThis quick guide focuses on the credit accumulation rate dashboard which provides the proportion of students meeting select credit accumulation thresholds during their first 4 years of enrollment by cohort year.
Credit Completion Ratio DashboardThis quick guide focuses on the credit completion ratio dashboard which provides the proportion of credits that students earned of the credits they attempted during their first year of enrollment by cohort year.
Gateway Course Completion DashboardThis quick guide focuses on the gateway course completion dashboard which provides the proportion of students who completed their required math or English gateway courses in their first year of enrollment by cohort year. It is limited to students who were required to complete math or English gateway courses.
Dashboard Quick Guides - Outcomes Over Time
Outcomes DashboardThis quick guide focuses on the outcomes dashboard which provides completion rates and other outcomes for students by cohort year.
Retention/Persistence DashboardThis quick guide focuses on the retention/persistence dashboard which provides first-to-second-year retention and persistence rates by cohort year.
Retention/Persistence Term-to-Term DashboardThis quick guide focuses on the retention/persistence term-to-term dashboard which provides term-to-term retention and persistence rates by cohort year for the first 2 years of enrollment.
Transfer DashboardThis quick guide focuses on the transfer dashboard which provides student rates of transfer from the cohort institution and other related outcomes, such as credentials earned pre- or post-transfer by cohort year.
Time to Credential/Credentials Conferred DashboardThis quick guide focuses on the time to credential/credentials conferred dashboard which provides the count of credentials awarded along with the average time to completion for credentials awarded by the institution by academic year.
PDP Conference Presentations - Examples of Data Use
Leveraging Analysis Ready File PDP Data for Understanding and ActionThis presentation by the American Institutes for Research (AIR) highlights how to utilize the PDP’s Analysis-Ready File (ARF) and visualize additional PDP data beyond the Tableau dashboards. In particular, it highlights data for student progression through developmental education and gateway courses, as well as understanding equity gaps.
Earlier this year, the State Higher Education Executive Officers Association (SHEEO) completed its Postsecondary Data Partnership Assistance to Community Colleges grant. Funded by the Bill & Melinda Gates Foundation, since January of 2019, SHEEO has provided technical assistance and support for the National Student Clearinghouse’s (Clearinghouse) Postsecondary Data Partnership (PDP). The Clearinghouse’s PDP platform was designed to improve and support the use of state- and institution-level postsecondary data and reduce related reporting burdens.
Through this grant, SHEEO provided convenings, presentations, research papers, guides, and a toolkit for institutions or state systems and agencies to establish and build on their capacity to report to the PDP. SHEEO also regularly met with the Association of Public and Land-grant Universities (APLU), American Association of State Colleges and Universities (AASCU), and Jobs for the Future (JFF) to provide targeted technical assistance and support to their institutional cohorts. Listed below are the many resources provided over the course of the grant, with a description of their focus, contents, and impact:
SHEEO’s PDP Toolkit: The toolkit is a public resource for higher education professionals interested in or already involved in the PDP and provides information that supports state and institutional adoption of the PDP. The toolkit explains why the PDP is important, how to get started, and how to submit and use data.
Although the grant is completed, SHEEO will continue to maintain the PDP Toolkit and associated documents on the SHEEO website under the completed projects section.
* * * * *
Acknowledgement: This blog is based on work funded in part by the Bill & Melinda Gates Foundation. Information contained within is that of the author(s) and does not necessarily reflect the positions or policies of the Bill & Melinda Gates Foundation
In November 2021, SHEEO supported a two-day workshop conducted by ASA Research and Seamless Strategies Group for the South Dakota Board of Technical Education institutions. The goals of the workshop – Know and Use Your Data with the PDP: Where are You? Where Do You Want to Be? How Can You Get There? –were, in part, to increase strategic data use capacity and elevate the usefulness of the Postsecondary Data Partnership (PDP)’s key performance indicators (KPIs). To help facilitate greater state- and institution-level use of the PDP, ASA provided participants with the three tools described below.
PDP and Strategic Data Use
Regardless of where your team is in using data and developing your strategic programming, policy, and data plans, you need to…
Understand how current and new programs, policies, and strategies can “move the needle” on student success indicators such as PDP Key Performance Indicators.
Set targets to help focus work and ensure efficient operations.
Develop a communications plan to ensure that all stakeholders have the right data when they need it and to tell your story.
…PDP data can support your campus’s strategic decision-making, target-setting, equity insights, and communication efforts to improve student success policies, practices, and outcomes.
Strategy and Metrics Map
Where Do You Want to Be? How Can You Get There?
ASA’s Strategy and Metrics Map is a visual framework that supports evidence-based decision-making and illustrates how strategies and programs move student behaviors and outcomes. This ASA tool:
Helps to create maps that visualize the linkages between your institution’s programs, policies, and strategies and the PDP KPIs.
Illustrates your college’s ability to “move the needle” based on your activities.
Facilitates target setting.
Is a precursor to developing a monitoring and assessment plan.
Helps to set up a communications plan and to tell your story.
The Strategy and Metrics Map provides a step-by-step process for improving student outcomes through PDP data and KPIs.
SMART Target Setting Guide
Status quo policies = Status quo outcomes
Using the SMART model – a widely used framework resulting in well-defined targets – the ASA SMART Target Setting Guide helps take the guesswork out of target setting and supports campus teams to establish appropriate targets that are…
Specific
Measurable
Attainable
Relevant
Timebound
…and supportive of your student success work.
The SMART Target Setting Guide provides methodologies, examples, and tips to consider for setting targets, and a template you can use to organize your targets.
Data Communications Planning Guide
Without Facts, You Cannot Act.
ASA’s Data Communications Planning Guide provides tips and a framework for developing a data communications plan for your campus. A campus with a strong data communications plan benefits by…
Promoting campus-wide data use.
Developing a shared understanding of data definitions and student outcomes.
Busting myths and reducing bias from decision-making.
Instilling common and collaborative goals.
Making informed strategic decisions.
The Data Communications Planning Guide includes tips for developing your data plan and a template for organizing and documenting progress.
* * * * *
More about ASA Research: ASA conducts workshops and coaching services to help institutions and networks use their student data strategically to drive change as they embark on large-scale student success reforms. Through interactive workshops, webinars, and guided conversations, ASA helps colleges and systems increase their capacity to make strategic use of data by arming them with customized models, guides, and tools such as those provided above. Please contact Sue Clery at ASA Research (sclery@asa-research.com) or visit www.asa-research.com for more information about these tools and ASA workshops and webinars.
Acknowledgment: The ASA workshop resources are provided by SHEEO in part through funding from the Bill & Melinda Gates Foundation. The recommendations and conclusions contained within are those of the author(s) and do not necessarily reflect positions or policies of the Bill & Melinda Gates Foundation.
The Postsecondary Data Partnership (PDP) is a nationwide effort to help institutions and state systems gain a fuller picture of student progress and outcomes, meet various reporting requirements, and identify where to focus their resources. The partnership is dedicated to the idea that easier access to better data helps higher education professionals develop actionable insights and make informed decisions to support student success. This blog post highlights four specific examples for using PDP data at the state level: state higher education strategic plans and Key Performance Indicators (KPIs), early momentum metrics, educational attainment models, and equity gap analysis.
State Higher Education Strategic Plans and Key Performance Indicators Data for state higher education strategic plans and KPIs should focus on high-level data elements that include all postsecondary students, are common measures within the field, and can be easily viewed at both the state and institution level. The PDP accomplishes all three of these objectives. First, it collects information on all new incoming students, including first time in college and transfer students, full-time and part-time students, and students beginning in the fall, spring, or summer terms. Second, the PDP is based on the Institute for Higher Education Policy’s (IHEP) Postsecondary Metrics Framework.[1] IHEP staff reviewed a decade’s worth of data elements and their definitions collected by national, state, and voluntary data collections in an attempt to bring consensus to the field regarding common data elements. The Postsecondary Metrics Framework is part of a larger effort for a more inclusive national data infrastructure that enables researchers and policymakers to better understand equity and student success. This work also helps support the validity of data elements and their importance in helping to understand barriers and improve student success. Third, online PDP Tableau dashboards provide state leadership with the ability to look at data at the state level and at individual institutions. Dashboard images can be saved to PowerPoint and Word documents, and aggregate dashboard data can be downloaded for further analysis.
Early Momentum Metrics
Traditionally, higher education has focused on lagging student outcomes, such as graduation rates. However, as we become more data-informed and understand how students move through the education space, it is more important to focus on leading, early, momentum metrics to help with decision-making. Research out of the Community College Research Center (CCRC) at Columbia University Teacher’s College evaluating the impact of credit momentum, gateway course momentum, and persistence momentum indicates that these early momentum metrics are strong predictors of student completion rates.[2] All three of these measures are part of the PDP, and dashboard data can be filtered by multiple dimensions at the same time, such as race/ethnicity, enrollment intensity, and academic preparation, to create targeted subgroups. Further, the PDP also collects early momentum data on developmental education courses and GPA.
State Educational Attainment Models
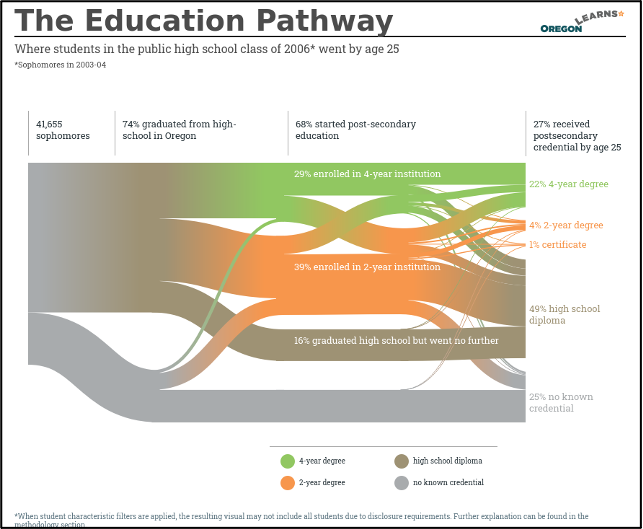
State educational attainment has been a driving force for state policy for over a decade, and reports such as Lumina’s Stronger Nation have helped highlight this work. Through our Communities of Practice project, SHEEO has also helped in this area by bringing together state teams to discuss how to model educational attainment. The state of Oregon has done great work visualizing education pathways from high school through postsecondary education.[3] PDP data on enrollment and early momentum metrics can add great benefit to educational attainment models. As states adjust early momentum metrics, such as gateway completion and retention in attainment models, they can gain a better sense of outcomes and how that impacts your state’s attainment rates.
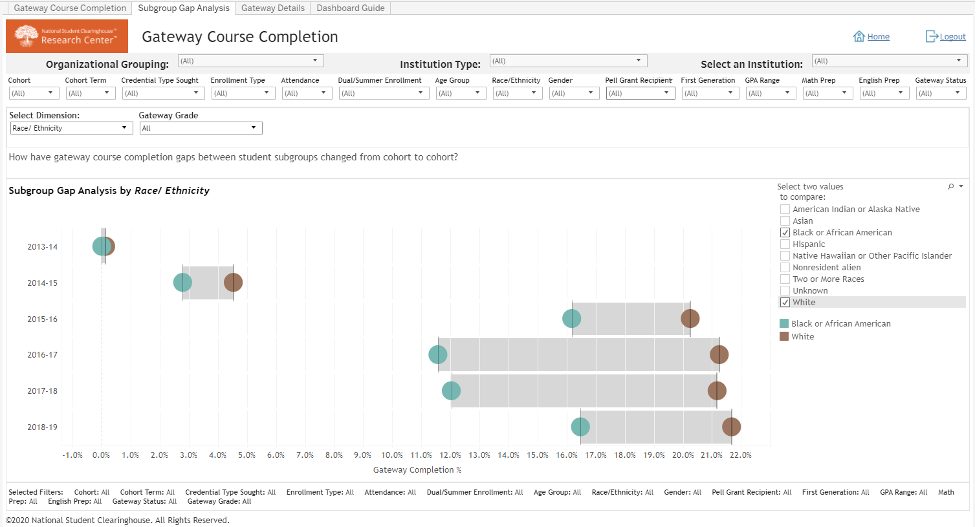
Equity Gap Analyses
One of the best PDP tools is the subgroup gap analysis within many of the dashboards that let viewers compare two specific groups of students on a specific measure. The subgroup gap analysis is a great way to visualize differences in equity, and the image can be easily downloaded for sharing. The image below shows an example of an equity subgroup analysis comparing gateway course completion for Black or African American students compared to white students. Looking at the data for the most recent three years, we see that the equity gaps decreased, but a larger four-year look does not show a consistent downward trend.